5.6: Interpreting the y-intercept of a Line
Learning Outcomes
- Interpret the
 -intercept of a line as the value of
  when
when  equals to 0.
 - Determine whether the
 -intercept is useful for interpreting the relationship between
  and
and 
Just like the slope of a line, many algebra classes go over the y-intercept of a line without explaining how to use it in the real world. The y-intercept of a line is the value of ![]() where the line crosses the y-axis. In other words, it is the value of
where the line crosses the y-axis. In other words, it is the value of ![]() when the value of
when the value of ![]() is equal to 0. Sometimes this has true meaning for the model that the line provides, but other times it is meaningless. We will encounter examples of both types in this section.
is equal to 0. Sometimes this has true meaning for the model that the line provides, but other times it is meaningless. We will encounter examples of both types in this section.
Example 5.6.1
A study was done to see the relationship between the ounces of meat, ![]() , that people eat each day on average and the hours per week,
, that people eat each day on average and the hours per week, ![]() they watch sports. The equation of the regression line was found to be:
they watch sports. The equation of the regression line was found to be:
![]()
Interpret the y-intercept of the regression line in the context of the study or explain why it has no practical meaning.
Solution
First, note that the y-intercept is the number that is not in front of the ![]() . Thus, the y-intercept is 1.3. Next, the y-intercept is the value of
. Thus, the y-intercept is 1.3. Next, the y-intercept is the value of ![]() when
when ![]() equals zero. For this example,
equals zero. For this example, ![]() represents the ounces of meat consumed each day. If
represents the ounces of meat consumed each day. If ![]() is equal to 0, this means the person does not consume any meat. Since there are people, called vegetarians, who consume no meat, it is meaningful to have an x-value of 0. The y-value of 1.3 represents the hours of sports the person watches. Putting this all together we can state:
is equal to 0, this means the person does not consume any meat. Since there are people, called vegetarians, who consume no meat, it is meaningful to have an x-value of 0. The y-value of 1.3 represents the hours of sports the person watches. Putting this all together we can state:
A vegetarian is predicted to watch 1.3 hours of sports each week.
Example 5.6.2
A neonatal nurse at Children’s Hospital has collected data on the birth weight, ![]() , in pounds the number of days,
, in pounds the number of days, ![]() , that the newborns stay in the hospital. The equation of the regression line was found to be
, that the newborns stay in the hospital. The equation of the regression line was found to be
![]()
Interpret the y-intercept of the regression line in the context of the study or explain why it has no practical meaning.
Solution
Again, we note that the y-intercept is the number that is not in front of the ![]() . Thus, the y-intercept is 45. Next, the y-intercept is the value of
. Thus, the y-intercept is 45. Next, the y-intercept is the value of ![]() when
when ![]() equals zero. For this example,
equals zero. For this example, ![]() represents the new born baby’s birth weight in pounds. If
represents the new born baby’s birth weight in pounds. If ![]() is equal to 0, this means the baby was born with a weight of 0 pounds. Since it makes no sense for a baby to weigh 0 pounds, we can say that the y-intercept of this regression line has no practical meaning.
is equal to 0, this means the baby was born with a weight of 0 pounds. Since it makes no sense for a baby to weigh 0 pounds, we can say that the y-intercept of this regression line has no practical meaning.
Example 5.6.3
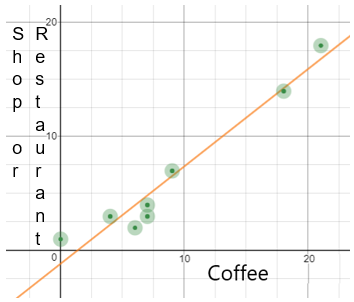
A researcher asked several people “How many cups of coffee did you drink last week?” and “How many times did you go to a shop or restaurant for a meal or a drink last week?” The scatterplot and the regression line from this study are shown below.

Interpret the y-intercept of the regression line in the context of the study or explain why it has no practical meaning.
Solution
The y-intercept of a line is where it crosses the y-axis. In this case, the line crosses at around y = -1. The value of ![]() , by definition is 0 and the x-axis represents the number of cups of coffee a person drank last week. Since there are people who don’t drink coffee, it does male sense to have an x-value of 0. The y-axis represents the number of times the person went to a shop or restaurant last week to purchase a meal or a drink. It makes no sense to say that a person went -1 times to a shop or restaurant last week to purchase a meal or a drink. Therefore the y-intercept of this regression line has no practical meaning.
, by definition is 0 and the x-axis represents the number of cups of coffee a person drank last week. Since there are people who don’t drink coffee, it does male sense to have an x-value of 0. The y-axis represents the number of times the person went to a shop or restaurant last week to purchase a meal or a drink. It makes no sense to say that a person went -1 times to a shop or restaurant last week to purchase a meal or a drink. Therefore the y-intercept of this regression line has no practical meaning.
Exercise
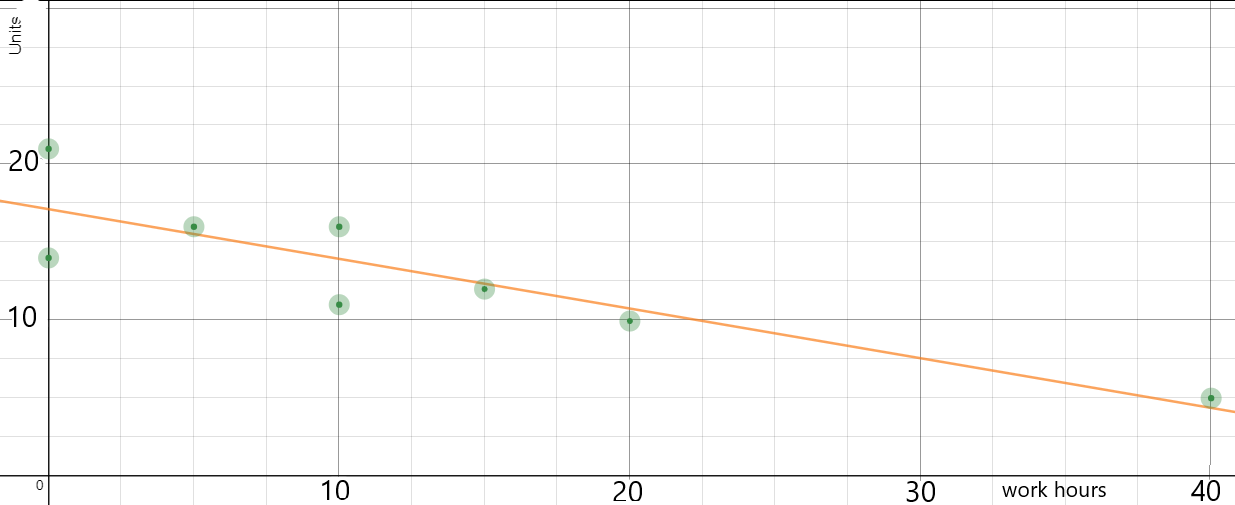
The scatterplot and regression line below are from a study that collected data from a group of college students on the number of hours per week during the school year they work at a paid job and the number of units they are taking. Interpret the y-intercept of the regression line or explain why it has no practical meaning.

VIDEO RESOURCES
SECTION WRAP-UP

