5.3: Find the Equation of a Line given its Graph
Learning Outcomes
- Find the slope of a line given its graph.
- Find the y-intercept of a line given its graph.
- Find the equation of a line given its graph.
There are two main ways of representing a line: the first is with its graph, and the second is with its equation. In this section, we will practice how to find the equation of the line if we are given the graph of the line. The two key numbers in the equation of a line are the slope and the y-intercept. Thus the main steps in finding the equation of a line are finding the slope and finding the y-intercept. In statistics we are often presented with a scatterplot where we can eyeball the line. Once we have the graph of the line, getting the equation is helpful for making predictions based on the line.
Finding the Slope of a Line Given Its Graph
The steps to follow to fine the slope of the line given its graph are the following.
Step 1: Identify two points on the line. Any two points will do, but it is recommended to find points with nice  and
and  coordinates.
Step 2: The slope is the rise over the run. Thus if the points have coordinates  and
and  , then the slope is:
![\[Slope\:=\:\frac{Rise}{Run}=\frac{y_2-y_1}{x_2-x_1}\nonumber \]](https://pressbooks.montgomerycollege.edu/app/uploads/quicklatex/quicklatex.com-1d1cdc831dc0fd9ce905cb2906957dd7_l3.png "Rendered by QuickLaTeX.com")
Example 5.3.1
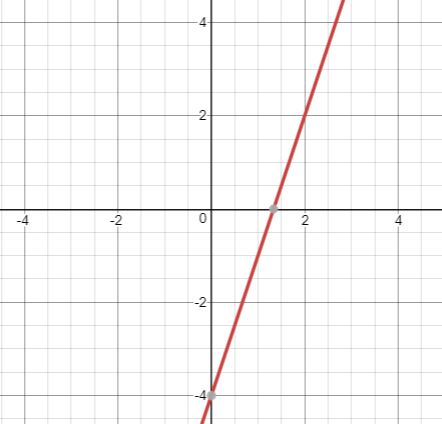
Find the slope of the line shown below.
Solution
First, we locate points on the line that are as easy as possible to work with. The points with integer coordinates are (0,-4) and (2,2).
Next, we use the rise over run formula to find the slope of the line.
![\[Slope\:=\:\frac{y_2-y_1}{x_2-x_1}=\frac{2-\left(-4\right)}{2-0}=\frac{6}{2}=3\nonumber \]](https://pressbooks.montgomerycollege.edu/app/uploads/quicklatex/quicklatex.com-f962c970c4f6e321f607958ce54bcc7e_l3.png "Rendered by QuickLaTeX.com")
Finding the y-intercept from the graph
If the portion of the graph that is in view includes the y-axis, then the y-intercept is very easy to spot. You just see where it crosses the y-axis. On the other hand, if the portion of the graph in view does not contain the y-axis, then it is best to first find the equation of the line and then use the equation to find the y-intercept.
Example 5.3.2
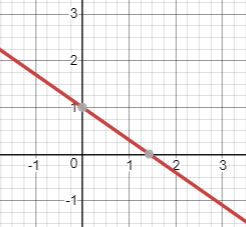
Find the y-intercept of the line shown below.
Solution
We just look at the line and notice that it crosses the y-axis at  . Therefore, the y-intercept is 1 or (0,1).
Finding the equation of the line given its graph
If you are given the graph of a line and want to find its equation, then you first find the slope as in Example  . Then you use one of the points you found
  when you computed the slope,
  , and put it into the point slope equation:
![\[y-y_1=m\left(x-x_1\right)\nonumber \]](https://pressbooks.montgomerycollege.edu/app/uploads/quicklatex/quicklatex.com-240e4423fcad06ac3864a4197f7721c3_l3.png "Rendered by QuickLaTeX.com")
Then you multiply the slope through and add  to both sides to get by itself.
Example 5.3.3
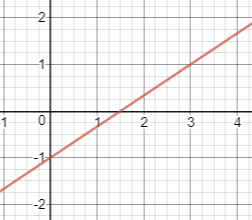
Find the equation of the line shown below.
Solution
First we find the slope by identifying two nice points. Notice that the line passes through (0,-1) and (3,1). Now compute the slope using the rise over run formula:
![\[Slope\:=\frac{\:rise}{run}=\frac{1-\left(-1\right)}{3-0}=\frac{2}{3}\nonumber \]](https://pressbooks.montgomerycollege.edu/app/uploads/quicklatex/quicklatex.com-847c6f7b9b758377731ca958a141dacd_l3.png "Rendered by QuickLaTeX.com")
Next use the point slope equation with the point (0,-1).
![\[y-\left(-1\right)=\frac{2}{3}\left(x-0\right)\nonumber \]](https://pressbooks.montgomerycollege.edu/app/uploads/quicklatex/quicklatex.com-25f57efe0e1a00b156fc024fcb2c215b_l3.png "Rendered by QuickLaTeX.com")
Now simplify:
![\[y+1=\frac{2}{3}x\nonumber \]](https://pressbooks.montgomerycollege.edu/app/uploads/quicklatex/quicklatex.com-8b639857eaf2be137d1a18a27ad92e00_l3.png "Rendered by QuickLaTeX.com")
Finally subtract 1 from both sides to get:
![\[y=\frac{2}{3}x-1\nonumber \]](https://pressbooks.montgomerycollege.edu/app/uploads/quicklatex/quicklatex.com-3470dc028cc4d69dfa317ee8bcda4275_l3.png "Rendered by QuickLaTeX.com")
Example 5.3.4
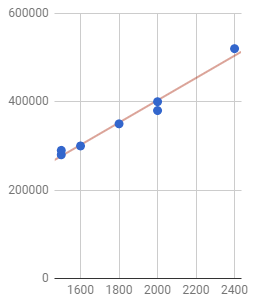
A study was done to look at the relationship between the square footage of a house and the price of the house. The scatter plot and regression line are shown below. Find the equation of the regression line.
Solution
First we find the slope by identifying two nice points. You will have to eyeball it and notice that the line passes through (1600, 300000) and (2000,400000). Now compute the slope using the rise over run formula:
![\[\frac{\:rise}{run}=\frac{400000-300000}{2000-1600}=\frac{100000}{400}=250\nonumber \]](https://pressbooks.montgomerycollege.edu/app/uploads/quicklatex/quicklatex.com-1e6e9cbac4e7dc8b005a16a7bac4516a_l3.png "Rendered by QuickLaTeX.com")
Next use the point slope equation with the point (2000,400000).
![\[y-\left(400000\right)=250\left(x-2000\right)\nonumber \]](https://pressbooks.montgomerycollege.edu/app/uploads/quicklatex/quicklatex.com-c50d1e94c4a52f5a7280de21721c02f5_l3.png "Rendered by QuickLaTeX.com")
Now simplify:
![\[y-400000=250x-500000\nonumber \]](https://pressbooks.montgomerycollege.edu/app/uploads/quicklatex/quicklatex.com-063c1f0f1bc4ed769321de4788771bad_l3.png "Rendered by QuickLaTeX.com")
Finally add 400000 to both sides to get:
![\[y=250x-100000\nonumber \]](https://pressbooks.montgomerycollege.edu/app/uploads/quicklatex/quicklatex.com-5f9997a619e9bdc4b7b65060bf90c0b4_l3.png "Rendered by QuickLaTeX.com")
Notice that although the y-intercept is not visible from the graph of the line, we can see from the equation of the line that the y-intercept is -100000 or (0,-100000).
Exercise
VIDEO RESOURCES
SECTION WRAP-UP
