2.3: Represent an Inequality as an Interval on a Number Line
Learning Outcomes
- Graph and inequality on a number line.
- Graph the complement on a number line for both continuous and discrete variables.
Inequalities come up frequently in statistics and it is often helpful to plot the inequality on the number line in order to visualize the inequality. This helps both for inequalities that involve real numbers and for inequalities that refer to just integer values. As an extension of this idea, we often want to look at the complement of an inequality, that is all numbers that make the inequality false. In this section we will look at examples that accomplish this task.
Sketching an Inequality on a number line where the possible values are real numbers.
There are four different inequalities:  . What makes this the most challenging is when they are expressed in words. Here are some of the words that are used for each:
 : “Less Than”, “Smaller”, “Lower”, “Younger”
 : “Less Than or Equal to”, “At Most”, “No More Than”, “Not to Exceed”
 : “Greater Than”, “Larger”, “Higher”, “Bigger”, “Older”, “More Than”
 : “Greater Than or Equal to”, “At Least”, “No Less than”
These are the most common words that correspond to the inequalities, but there are others that come up less frequently.
Example 2.3.1
Graph the inequality:  on a number line
Solution
First notice that the interval does not include the number 3, but does include the number 5. We can represent not including a number with an open circle and including a number with a closed circle. The number line representation of the inequality is shown below.

Example 2.3.2
In statistics, we often want to find probabilities of an event being at least as large or no more than a given value. It helps to first plot the interval on a number line. Suppose you want to find the probability that you will have to wait in line for at least 4minutes. Sketch this inequality on a number line.
Solution
First, notice that “At Least” has the symbol . Thus, we have a closed circle on the number 4. There is no upper bound, so we draw a long arrow from 4 to the right of 4. The solution is shown below

Example 2.3.3
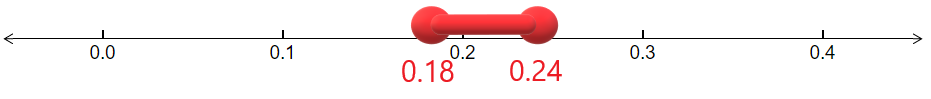
Another main topic that comes up in statistics is confidence intervals. For example in recent poll to see the percent of Americans who think that Congress is doing a good job found that a 95% confidence interval had lower bound of 0.18 and an upper bound of 0.24. This can be written as [0.18,0,24]. Sketch this interval on the number line.
Solution
The first thing we need to do is decide on the tick marks to put on the number line. If we counted by 1’s, then the interval of interest would be too small to stand out. Instead we will count by 0.1’s. The number line is shown below.
Example 2.3.4
Often in statistics, we deal with discrete variables. Most of the time this will mean that only whole number values can occur. For example, you want to find out the probability that a college student is taking at most three classes. Graph this on a number line.
Solution
First note that the outcomes can only be whole numbers. Second, note that “at most” means . Thus the possible outcomes are: 0, 1, 2, and 3. The number line below displays these outcomes.

Graphing the Complement
In statistics, we often want to graph the complement of an interval. The complement means everything that is not in the interval.
Example 2.3.5
Graph the complement of the interval [2,4).
Solution
Notice that the complement of numbers inside the interval between 2 and 4 is the numbers outside that interval. This will consist of the numbers to the left of 2 and to the right of 4. Since the number 2 is included in the original interval, it will not be included in the complement. Since the number 4 is not included in the original interval, it will be included in the complement. The complement is shown on the number line below.
![Line Interval -infinity to 2] and (4 to infinity](https://pressbooks.montgomerycollege.edu/app/uploads/sites/27/2022/04/intervalComplementOf2to4.png)
Example 2.3.6
Some calculators can only find probabilities for values less than a certain number. If we want the probability of an interval greater than a number, we need to use the complement. Suppose that you want to find the probability that a person will have traveled to more than two foreign countries in the last twelve months. Find the complement of this and graph it on a number line.
Solution
First notice that only whole numbers are possible since it does not make sense to go to a fractional number of countries. Second note that the lowest number that is more than 2 is 3. If 3 is included in the original list, then 3 will not be included in the complement. Thus, the highest number that is in the complement of “more than 2” is 2. The number line below shows the complement of more than 2.

Exercise
Suppose you want to find the probability that at least 4 people in your class have a last name that contains the letter “W”. To make this calculation you will need to first find the complement of “at least 4”. Sketch this complement on the number line.
VIDEO RESOURCES
SECTION WRAP-UP
