5.5: Interpreting the Slope of a Line
Learning Outcomes
- Interpret the slope of a line as the change in
 when
when  changes by 1.
A common issue when we learn about the equation of a line in algebra is to state the slope as a number, but have no idea what it represents in the real world. The slope of a line is the rise over the run. If the slope is given by an integer or decimal value we can always put it over the number 1. In this case, the line rises by the slope when it runs 1. “Runs 1” means that the x value increases by 1 unit. Therefore the slope represents how much the y value changes when the x value changes by 1 unit. In statistics, especially regression analysis, the x value has real life meaning and so does the y value.
Example 5.5.1
A study was done to see the relationship between the time it takes, , to complete a college degree and the student loan debt incurred, . The equation of the regression line was found to be:
![\[y=25142\:+14329x\]](https://pressbooks.montgomerycollege.edu/app/uploads/quicklatex/quicklatex.com-597744c1c2f3ee05213b68947d0dfc2f_l3.png "Rendered by QuickLaTeX.com")
Interpret the slope of the regression line in the context of the study.
Solution
First, note that the slope is the coefficient in front of the . Thus, the slope is 14,329. Next, the slope is the rise over the run, so it helps to write the slope as a fraction:
![\[Slope\:=\frac{\:rise}{run}=\frac{14,329}{1}\]](https://pressbooks.montgomerycollege.edu/app/uploads/quicklatex/quicklatex.com-7f409c852ec70b01fe7c1906976fb49e_l3.png "Rendered by QuickLaTeX.com")
The rise is the change in and represents student loan debt. Thus, the numerator represents an increase of $14,329 of student loan debt. The run is the change in and represents the time it takes to complete a college degree. Thus, the denominator represents an increase of 1 year to complete a college degree. We can put this all together and interpret the slope as telling us that for every additional year it takes to complete a college degree, on average the student loan debt increases by $14,329.
Example 5.5.2
Suppose that a research group tested the cholesterol level of a sample of 40 year old women and then waited many years to see the relationship between a woman’s HDL cholesterol level in mg/dl, , and her age of death, . The equation of the regression line was found to be:
![\[y=103\:-0.3x\]](https://pressbooks.montgomerycollege.edu/app/uploads/quicklatex/quicklatex.com-d699b126dc2d2cc707adf91f08451a83_l3.png "Rendered by QuickLaTeX.com")
Interpret the slope of the regression line in the context of the study.
Solution
The slope of the regression line is -0.3. The slope as a fraction is:
![\[Slope\:=\dfrac{\:rise}{run}=\frac{-0.3}{1}\]](https://pressbooks.montgomerycollege.edu/app/uploads/quicklatex/quicklatex.com-5b11ef227fb1f492e94fb216b6d2e822_l3.png "Rendered by QuickLaTeX.com")
The rise is the change in and represents age of death. Since the slope is negative, the numerator indicates a decrease in lifespan. Thus, the numerator represents a decrease in lifespan of 0.3 years. The run is the change in and represents the HDL cholesterol level. Thus, the denominator represents an HDL cholesterol level increase of 1 mg/dl. Now, put this all together and interpret the slope as telling us that for every additional 1 mg/dl of HDL cholesterol, on average women are predicted to die 0.3years younger.
Example 5.5.3
A researcher asked several employees who worked overtime “How many hours of overtime did you work last week?” and “On a scale from 1 to 10 how satisfied are you with your job?”. The scatterplot and the regression line from this study are shown below.
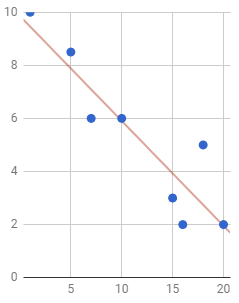
Interpret the slope of the regression line in the context of the study.
Solution
We first need to determine the slope of the regression line. To find the slope, we get two points that have as nice coordinates as possible. From the graph, we see that the line goes through the points (10,6) and (15,4). The slope of the regression line can now be found using the rise over the run formula:
![\[Slope\:=\frac{\:rise}{run}=\frac{4-6}{15-10}=\frac{-2}{5}\]](https://pressbooks.montgomerycollege.edu/app/uploads/quicklatex/quicklatex.com-e374f398496c200e4ff7678e55e893aa_l3.png "Rendered by QuickLaTeX.com")
The rise is the change in and represents job satisfaction rating. Since the slope is negative, the numerator indicates a decrease in job satisfaction. Thus, the numerator represents a decrease in job satisfaction of 2 on the scale from 1 to 10. The run is the change in and represents the overtime work hours. Thus, the denominator represents an increase of 5 hours of overtime work. Now, put this all together and interpret the slope as telling us that for every additional 5 hours of overtime work that employees are asked to do, their job satisfaction goes down an average of 2 points.
Exercise
VIDEO RESOURCES
SECTION WRAP-UP
