13 Randomization Tests
1. MEANS
Randomization Test for a Meannew
window | Randomization Test for a Difference
in Meansnew window
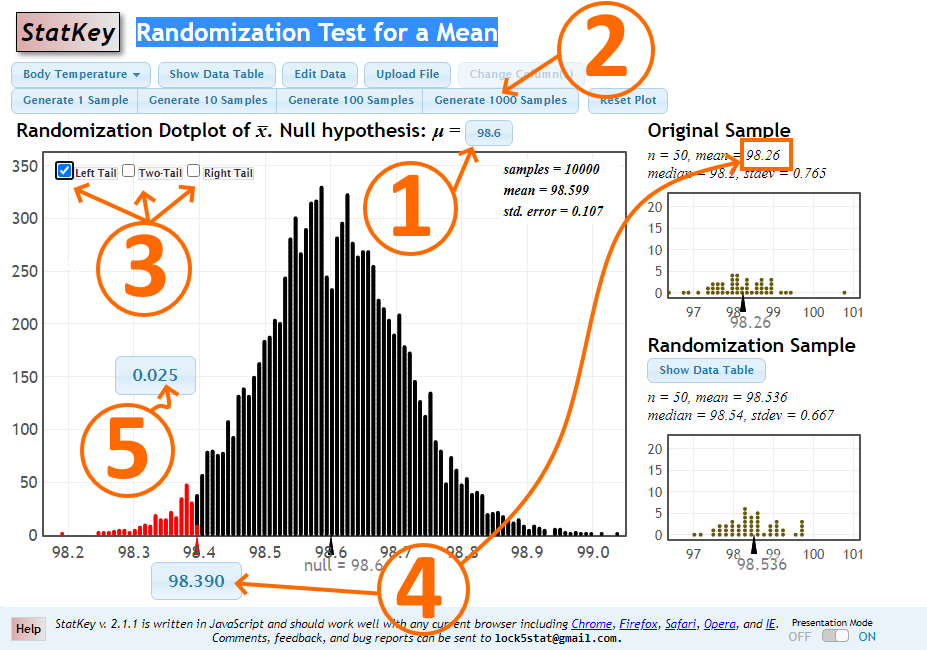
STEP 1: Enter your Null hypothesis value. For two sample cases, the Null will be already listed as µ1 = µ2.
STEP 2: Generate several thousand samples (say, 10,000 samples) by clicking on the Generate 1000 Samples button several times.
STEP 3: Select the tail type of your test.
STEP 4: Change the value in the box below the horizontal axis to match your sample mean. For two sample tests, match the value below the axis with the difference in the means, x̅1 − x̅2, displayed in the Original Sample section (top-right).
NOTE: For two-tailed tests, there will be two values under the horizontal axis. Change
the value of the box that is of the same sign as the original sample statistic.
STEP 5: For one-tailed test, this area is the p-value. For two-tailed tests, the p-value
equals the total of the two tail areas. Area(s) representing p-value(s) will be shaded in red.
Calculator Screenshot

2. PROPORTIONS
Randomization Test for a Proportionnew window | Randomization Test for a Difference in Proportionsnew window
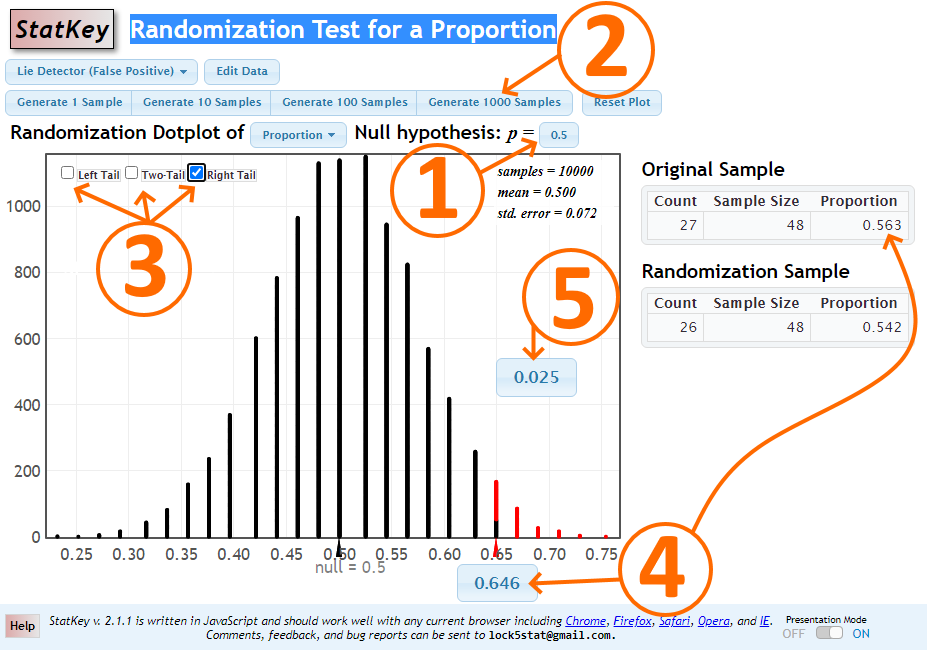
STEP 1: Enter your Null hypothesis value. For two sample cases, the Null will be already listed as p1 = p2.
STEP 2: Generate several thousand samples (say, 10,000 samples) by clicking on the Generate 1000 Samples button several times.
STEP 3: Select the tail type of your test.
STEP 4: Change the value in the box below the horizontal axis to match your sampleproportion
(p-hat). For two sample tests, match the value below the axis with the difference in the sample proportions displayed at the bottom right of the table in the Original Sample section (top-right).
NOTE: For two-tailed tests, there will be two values under the horizontal axis. Change the value of the box that is of the same sign as the original sample statistic.
STEP 5: For one-tailed test, this area is the p-value. For two-tailed tests, the p-value equals the total of the two tail areas. Area(s) representing p-value(s) will be shaded in red.
Calculator Screenshot


