5 Linear Regression and Correlation
1. DESMOS
LINEAR REGRESSION and CORRELATIONnew window
Make sure to view the Regression Tournew window first before using Desmos for regressions.
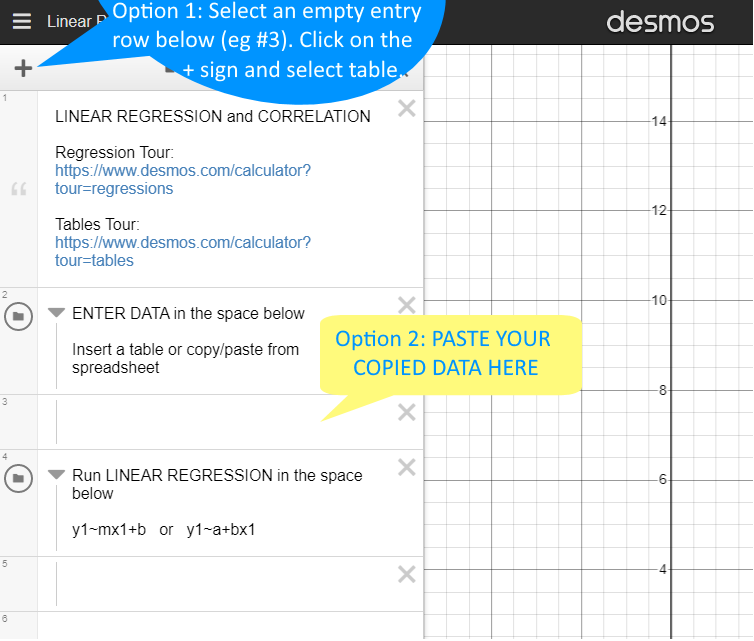
Screenshot of Desmos Regression Entry
2. STATKEY
For linear regression, follow the Two Quantitative Variablesnew window link under Descriptive Statistics and Graphs on the main StatKey page. This is the same one from Descriptive statistics above.
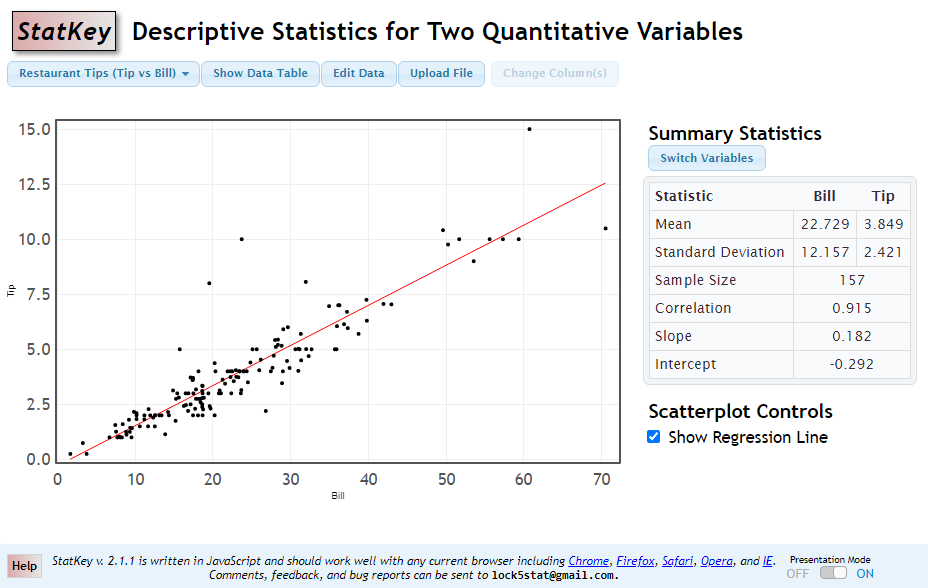
Enter your data values by clicking on the EDIT Data button. Your summary statistics should automatically show.
Use the options to switch variables or Show Regression Line as necessary.
Screenshot of Descriptive Statistics for Two Quantitative Variables with regression equation shown.


