3 Graphs: Boxplots, Dotplots, Histograms, Scatterplots
Descriptive Statistics
1. STATKEY
Descriptive Statistics and Graphs
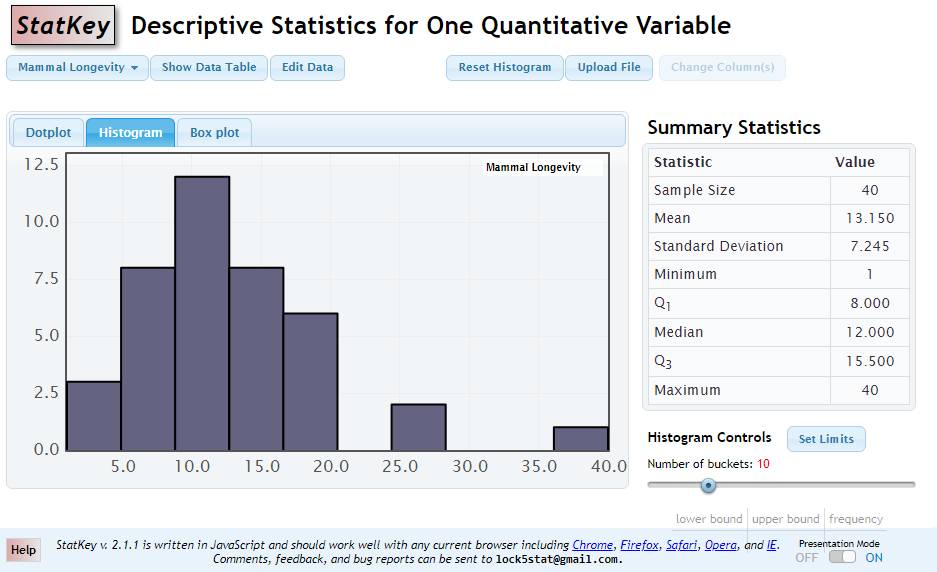
In addition to the summary statistics, StatKey also can nicely graph supplied data.
- One Quantitative Variablenew window [Dotplot, Histogram, Box plot]
- One Categorical Variablenew window [Bar Graph]
-
One Quantitative and one Categorical Variablenew window [Dotplot, Histogram,
Box plot] - Two Categorical Variablesnew window [Bar Graph]
- Two Quantitative Variablesnew window [Scatterplot]
Calculator Screenshot


