12 Bootstrap Confidence Intervals
1. MEANS
Bootstrap Confidence Interval for:
Confidence Interval for a Meannew window | Difference in Meansnew window
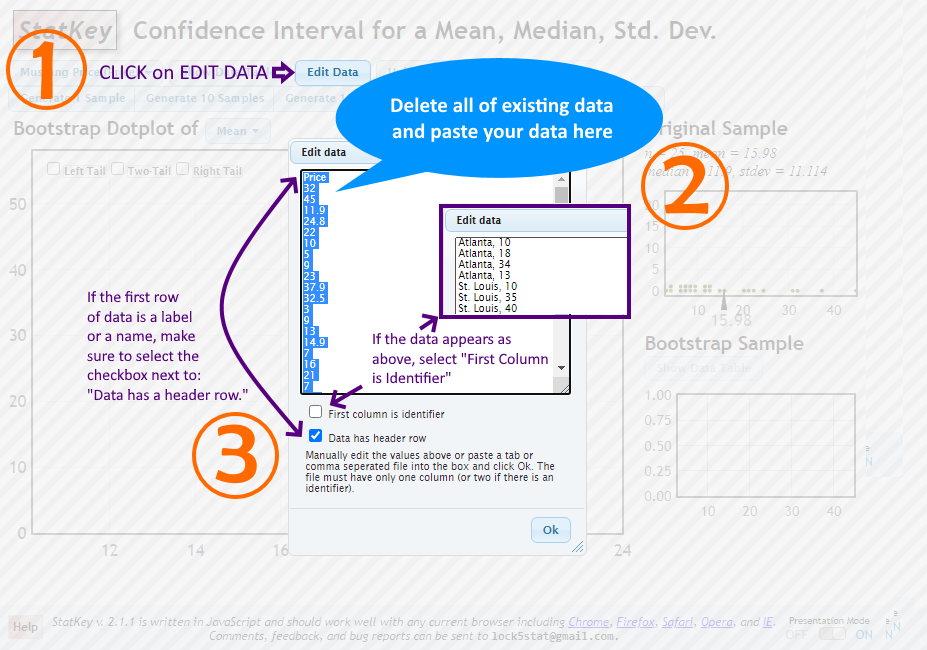
STEP 1: Enter the original sample data into StatKey by clicking on Edit Data.

Manually edit the values or paste a tab or comma seperated file into the box and click Ok.
If updating a data file, ensure there’s only one column (or two if there is an identifier).
Note: Data entry and confidence interval calculation process for a difference in means is similar.
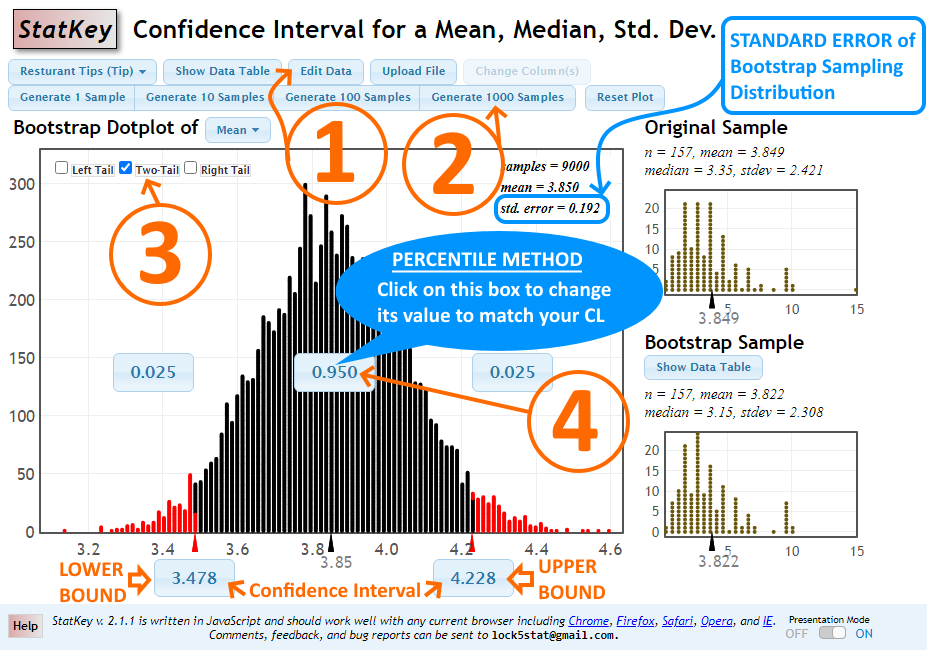
STEP 2: Generate several thousand samples (say, 10,000 samples) by clicking on the Generate 1000 Samples button several times.
If you’re calculating Bootstrap confidence intervals by plugging in the standard error, use the value of std. error shown on the Bootstrap dotplot.
For PERCENTILE Method, continue with the following steps.
STEP 3: Select TWO-TAIL for confidence intervals.
STEP 4: Change the middle area/proportion to match your confidence level.
After STEP 4, the lower and upper bounds of your confidence interval are shown below the horizontal axis on the main graph. See image below.
Calculator Screenshot

2. PROPORTIONS
Bootstrap Confidence Interval for:
Proportionnew
window | Difference in Proportionsnew
window
STEP 1: Enter the original sample data into StatKey by clicking on Edit Data. Enter the sample size and the count/frequency for each sample in the dialog box.
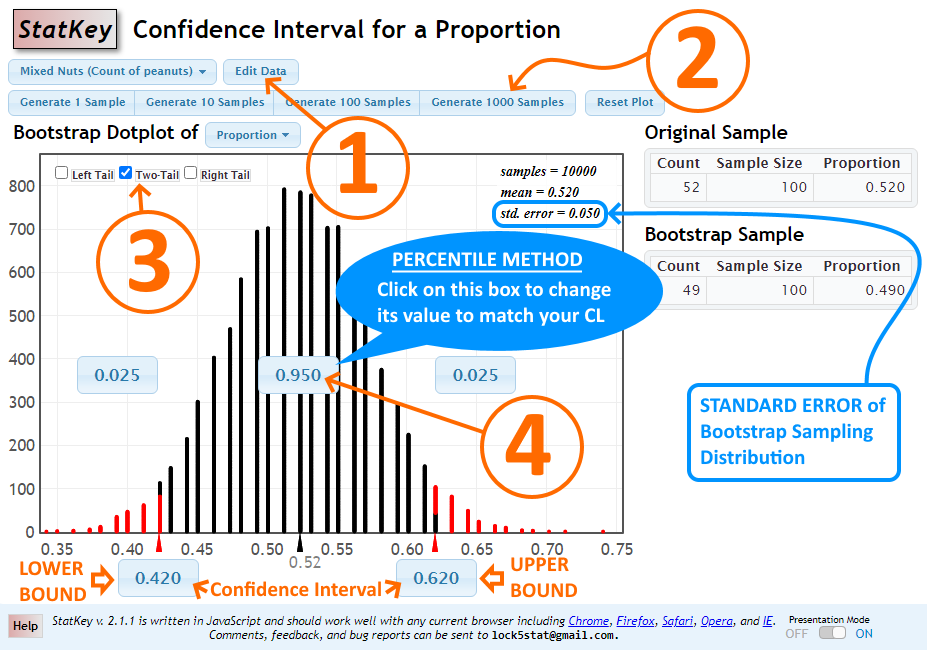
STEP 2: Generate several thousand samples (say, 10,000 samples) by clicking on the Generate 1000 Samples button several times.
If you’re calculating Bootstrap confidence intervals by plugging in the standard error, use the value of std. error shown on the Bootstrap dotplot.
For PERCENTILE Method, continue with the following steps.
STEP 3: Select TWO-TAIL for confidence intervals.
STEP 4: Change the middle area/proportion to match your confidence level.
After STEP 4, the lower and upper bounds of your confidence interval are shown below the horizontal axis on the main graph. See image below.
Calculator Screenshot


