
UNIT 8: HYPOTHESIS TESTING FOR MEANS (NUMERICAL DATA)
We explore Hypothesis Testing with numerical data. We will start off with a discussion of testing a claim about a population parameter and extend the discussion to comparing two independent population proportions.
TOPICS COVERED
- Independent and Dependent Samples
- Hypothesis Testing for a Mean
- Testing the Difference Between Two Means – Independent and Dependent Samples
LEARNING OUTCOMES
- Classify hypothesis tests by type: One sample, two samples, and Independent, Dependent (Matched Pair)
- Conduct and interpret hypothesis tests for a single population mean and two population means, where population standard deviation is known or unknown
- Use technology (Online/Graphing calculators, Excel, R, etc.) to perform hypothesis tests
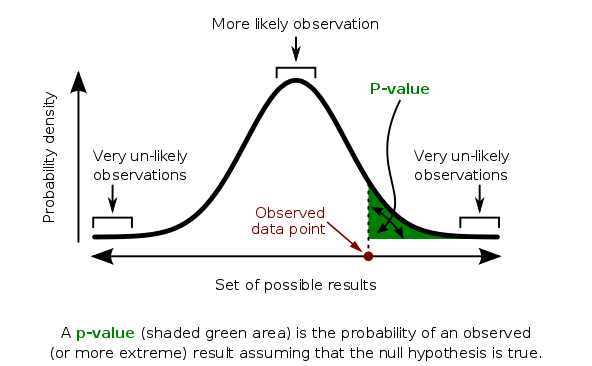
- Use p-values and statistical significance to make decisions and conclusions related to hypothesis testing
