UNIT 2: DESCRIBING DATA
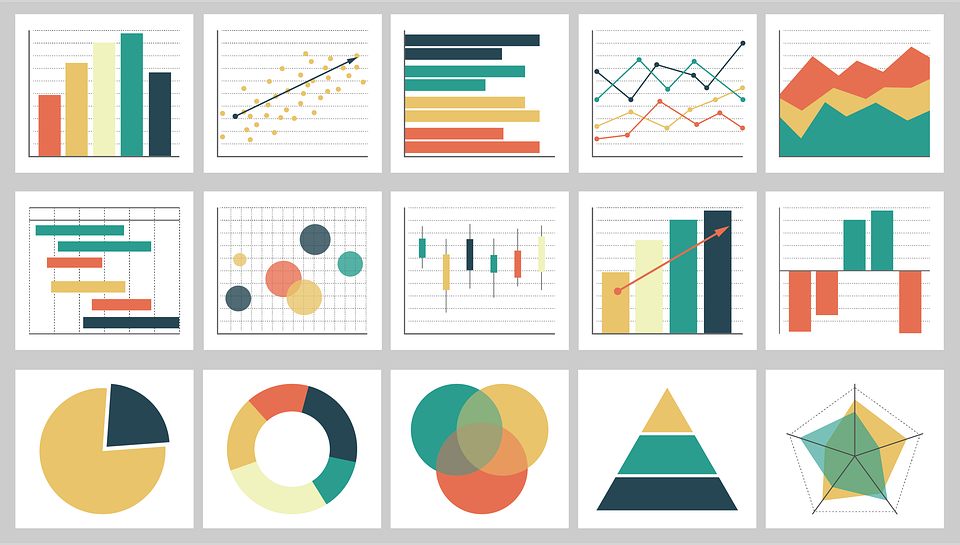
Once data has been collected, we can describe data more effectively using graphs or numerical summaries. This unit introduces various graphical and numerical methods of describing data. It is important to choose appropriate methods for describing data depending on data types. We also need to be aware of graphs and displays that are misleading.

UNIT CONTENTS
- 2.1 Stem-and-Leaf Graphs (Stemplots), Line Graphs, and Bar Graphs
- 2.2 Histograms, Frequency Polygons, and Time Series Graphs
- 2.3 Measures of the Location of the Data
- 2.4 Box Plots
- 2.5 Measures of the Center of the Data
- 2.6 Skewness and the Mean, Median, and Mode
- 2.7 Measures of the Spread of the Data
- KEY TERMS
TOPICS COVERED
- Graphical displays and interpretation of data: Stemplots, Dotplots, Histograms, and Box plots
- Measures of location of data: quartiles and percentiles
- Measures of the center of data: mean, median, and mode
- Measures of the spread of data: variance, standard deviation, and range
- z-scores, Empirical Rule, Chebychev’s Rule
LEARNING OUTCOMES
- Summarize data graphically using appropriate graphs
- Describe characteristics of data from graphical displays
- Calculate numerical summaries of data to describe the center, position, and spread of data sets
- Describe quantitative data using five-number summaries
- Identify outliers in a data set

