8.3 A Population Proportion
Recall that the margin of error depends on the standard error of the sampling distribution of the sample statistic estimating the parameter and the desired level of confidence:
Margin of Error = (Critical Value) • (Standard Error)
Finding Critical Values
Use Desmos or Statkey. (Note: If you need to use more than 3 decimal places for the critical value, you may want to skip StatKey)
Critical z value using Desmos | Critical z-value using StatKey (no audio)
Standard Errors
Recall that the CLT says the sampling distribution of sample statistics will be normal or approximately normal if CLT requirements are met.
For proportions, the Standard Error = the standard deviation of the sampling distribution of sample proportions ([latex]\hat p[/latex])
Standard Error of the proportion = [latex]\sigma_{\hat p} = \sqrt {\dfrac{p(1-p)}{n}}[/latex].
If the population proportion is unknown, we can use [latex]\hat p[/latex] in place of p as long as the CLT conditions for proportions are satisfied.
EXAMPLE: PROPORTION
The table below shows the results of an exam summarized by gender and grade for a group of students.
| Gender | A | B | C | Total |
|---|---|---|---|---|
| Male | 11 | 9 | 10 | 30 |
| Female | 15 | 17 | 12 | 44 |
| Total | 26 | 26 | 22 | 74 |
Let [latex]p[/latex] represent the percentage of all male students who would receive a grade of C on this test. Use a 99.5% confidence interval to estimate [latex]p[/latex] to three decimal places.
Enter your answer as a tri-linear inequality using decimals (not precents).
Assume the data is from a normally distributed population. Round your answers to 3 decimals.
SHOW SOLUTION
Regular way:
[latex]p[/latex] = Proportion of all male students with a C grade (Sometimes this is also represented by [latex]\pi[/latex])
Confidence level, c = 0.995 (for a 99.5% confidence interval)
Sample info (These include sample statistics):
x = number of successes = # of males in the sample who obtained a C = 10
n = total number of males in the sample = 30
[latex]\hat p = \dfrac x n = ...[/latex] (Also known as [latex]\hat \pi[/latex])
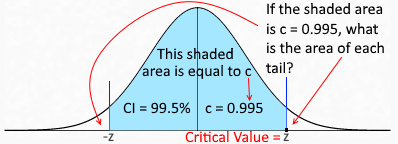
Draw a standard normal distribution and shade this area in the middle. Confidence level represents the middle area. Use that to find the z-score of the right end point of the shaded part z, which will be your critical value.

Critical value, z = inversecdf(0.9975) = ......... (Wait, why 0.9975?)
Margin of Error, ME (or EBP) =[latex]z \sqrt {\dfrac{\hat p \hat q}{n}}[/latex]
ONLINE CALCULATOR Approach
SUBEDI Calculator
Go to Confidence Interval for a Proportion calculator @ rsubedi.com
Confidence Level (in decimal), [latex]c: \fbox{$\mathstrut\;0.995\;$}[/latex]
Number of Samples
Sample Statistics Information
Sample size, [latex]n: \fbox{$\mathstrut\;30\;$}[/latex]
Successes, [latex]x: \fbox{$\mathstrut\;10\;$}[/latex]
CALCULATE
Results show in a panel to the right. CI is displayed in [latex]\pm[/latex] notation.
LibreText Calculator
Go to: Confidence Interval Calculator for a Proportion from the list of online calculators.
Enter the following values and press Calculate.
CALCULATE
Results displayed are:
Sample Size Calculations
According to Central Limit Theorem, sample proportions ([latex]\hat p[/latex]) follow a normal distribution with a mean equal to the population proportion [latex]p[/latex] and a standard error of \[\sigma_{\hat p}=\sqrt{\frac{p(1-p)}{n}}\] Recall that margin of error is given by \[ME = z_c\cdot(\text{Standard Error})\] which can be written as \[ME = z_c\cdot \sqrt{\frac{p(1-p)}{n}}\] We will solve this equation for [latex]n[/latex]. To start, divide both sides by [latex]z_c[/latex] and square both sides \[\begin{aligned} \frac{ME}{z_c}&=\sqrt{\frac{p(1-p)}{n}}\\ \left(\frac{ME}{z_c}\right)^2&=\left(\sqrt{\frac{p(1-p)}{n}}\right)^2 \\ \frac{ME^2}{z_c^2}&=\frac{p(1-p)}{n} \end{aligned}\] Now, multiply both sides by [latex]n[/latex] we get \[n\cdot \left(\frac{ME}{z_c}\right)^2=\bcancel{n}\cdot\frac{p(1-p)}{\bcancel{n}}=p(1-p)\] Next we need to free [latex]n[/latex] by itself, we multiply both sides by [latex]\left(\dfrac{z_c}{ME}\right)^2[/latex] we get \[n\cdot \bcancel{\left(\frac{ME}{z_c}\right)^2}\bcancel{\left(\frac{z_c}{ME}\right)^2}=p(1-p)\left(\frac{z_c}{ME}\right)^2\] and this simplifies to our formula for the required sample size [latex]n[/latex]: \[n=p(1-p)\left(\frac{z_c}{ME}\right)^2\] Calculating the required sample size using this formula will almost always result in a decimal value for [latex]n[/latex]. Since the sample size has to be a positive integer, we will need to do some rounding. We will always round up the final answer for sample size calculations[1] and indicate this in the formula by using the ceiling function (round up to the nearest integer): \[n=\left\lceil p(1-p)\left(\frac{z_c}{ME}\right)^2\right\rceil\]
DEMO EXAMPLE WITH PRACTICE
ONLINE CALCULATOR Approach
SUBEDI Calculator
Go to Sample Size Calculator @ rsubedi.com
Estimate for
Preliminary Estimate for p available?
Estimate for [latex]p: \fbox{$\mathstrut\phantom{EMPTY} $}[/latex]
Margin of Error, [latex]ME: \fbox{$\mathstrut\phantom{EMPTY} $}[/latex]
Confidence Level (in decimal), [latex]c: \fbox{$\mathstrut\phantom{EMPTY} $}[/latex]
CALCULATE
Results show in a panel to the right. CI is displayed in [latex]\pm[/latex] notation.
LibreText Calculator
Go to: Sample Size for a Proportion from the list of online calculators.
Enter the following values and press Calculate.
CALCULATE
Results displayed are:
Additional Practice
Review: Determining sample size based on confidence and margin of error
Please complete the practice exercise Sample size for Proportions
- If the value of [latex]n[/latex] comes out to, say, 46.234, then we need at least that many to ensure all the requirements are met. Although the conventional rounding of 46.234 will give us 46, a sample size of 46 is not enough guarantee that the required margin of error and the confidence level are satisfied. We should, therefore, choose an integer that's just above our calculated decimal value of [latex]n[/latex], which in this case is 47. ↵

