
Appendix B
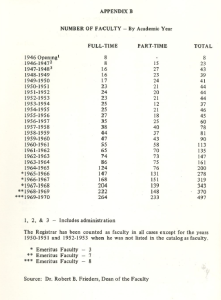
NUMBER OF FACULTY – By Academic Year
| Academic Year | FULL-TIME | PART-TIME | TOTAL |
|---|---|---|---|
| 1946 Opening¹ | 8 | — | 8 |
| 1946–1947² | 8 | 15 | 23 |
| 1947–1948³ | 16 | 27 | 43 |
| 1948–1949 | 16 | 23 | 39 |
| 1949–1950 | 17 | 24 | 41 |
| 1950–1951 | 23 | 21 | 44 |
| 1951–1952 | 24 | 20 | 44 |
| 1952–1953 | 23 | 21 | 44 |
| 1953–1954 | 25 | 12 | 37 |
| 1954–1955 | 25 | 21 | 46 |
| 1955–1956 | 27 | 18 | 45 |
| 1956–1957 | 35 | 25 | 60 |
| 1957–1958 | 38 | 40 | 78 |
| 1958–1959 | 44 | 37 | 81 |
| 1959–1960 | 47 | 43 | 90 |
| 1960–1961 | 55 | 58 | 113 |
| 1961–1962 | 65 | 70 | 135 |
| 1962–1963 | 74 | 73 | 147 |
| 1963–1964 | 86 | 75 | 161 |
| 1964–1965 | 124 | 76 | 200 |
| *1965–1966 | 147 | 131 | 278 |
| *1966–1967 | 168 | 151 | 319 |
| *1967–1968 | 204 | 139 | 343 |
| **1968–1969 | 222 | 148 | 370 |
| ***1969–1970 | 264 | 233 | 497 |
¹, ², & ³ – Includes administration.
The Registrar has been counted as faculty in all cases except for the years 1950–1951 and 1952–1953 when not listed in the catalog as faculty.
- *Emeritus Faculty – 3
- ** Emeritus Faculty – 7
- *** Emeritus Faculty – 8
Source: Dr. Robert B. Frieders, Dean of the Faculty
Media Attributions
- Faculty Growth by Academic Year, 1946–1970