Want to create or adapt books like this? Learn more about how Pressbooks supports open publishing practices.
Appendix A
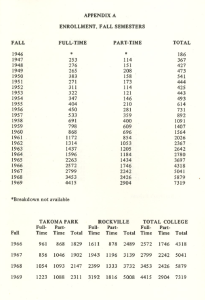
ENROLLMENT, FALL SEMESTERS
FALL
FULL-TIME
PART-TIME
TOTAL
1946
*
114
186
1947
253
114
367
1948
276
151
427
1949
265
208
473
1950
283
158
541
1951
271
173
444
1952
311
114
425
1953
294
121
443
1954
347
146
493
1955
404
210
614
1956
450
281
731
1957
533
359
892
1958
691
400
1091
1959
798
609
1407
1960
868
696
1564
1961
1172
854
2026
1962
1314
1053
2367
1963
1437
1205
2642
1964
1596
1184
2780
1965
2263
1434
3697
1966
2572
1746
4318
1967
2799
2242
5041
1968
3453
2426
5879
1969
4415
2904
7319
* Breakdown not available
Campus Breakdown
FALL
Takoma Park Full-Time
Part-Time
Total
Rockville Full-Time
Part-Time
Total
Total College Full-Time
Part-Time
Total
1966
961
868
1829
1611
878
2489
2572
1746
4318
1967
856
1046
1902
1943
1196
3139
2799
2242
5041
1968
1054
1093
2147
2399
1333
3732
3453
2426
5879
1969
1223
1088
2311
3192
1816
5008
4415
2904
7319
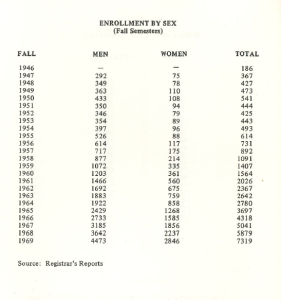
ENROLLMENT BY SEX (Fall Semesters)
FALL
MEN
WOMEN
TOTAL
1946
—
—
186
1947
292
75
367
1948
349
78
427
1949
363
110
473
1950
433
108
541
1951
350
94
444
1952
346
79
425
1953
354
89
443
1954
397
96
493
1955
526
88
614
1956
614
117
731
1957
777
115
892
1958
877
214
1091
1959
1072
335
1407
1960
1203
361
1564
1961
1466
560
2026
1962
1692
675
2367
1963
1883
759
2642
1964
1922
858
2780
1965
2429
1268
3697
1966
2733
1585
4318
1967
3185
1856
5041
1968
3642
2237
5879
1969
4473
2846
7319
Source: Registrar’s Reports
This table documents the significant increase in both full-time and part-time student enrollment at Montgomery College from its founding in 1946 through 1969. A campus breakdown beginning in 1966 reflects the institution’s expansion to Rockville.This table presents the fall enrollment at Montgomery College disaggregated by gender, showing trends in student demographics from 1946 to 1969. By 1969, women made up over a third of the student population, indicating a steady shift toward gender balance.